Copyright© 2026. All Rights Reserved by Euro American Education.
What is Nominal Data? Definition, Examples, Variables & Analysis
Nominal data is the most basic and simplest level of measurement, serving as a cornerstone in statistics, analytics, and research work. Despite being the simplest form of data, nominal data is essential when it comes to categorizing information ranging from survey responses to demographic data and much more. In this article, you will find important information about nominal data, its characteristics and examples, methods of analysis, comparisons to ordinal data, and practical insights to help you comprehend nominal data.
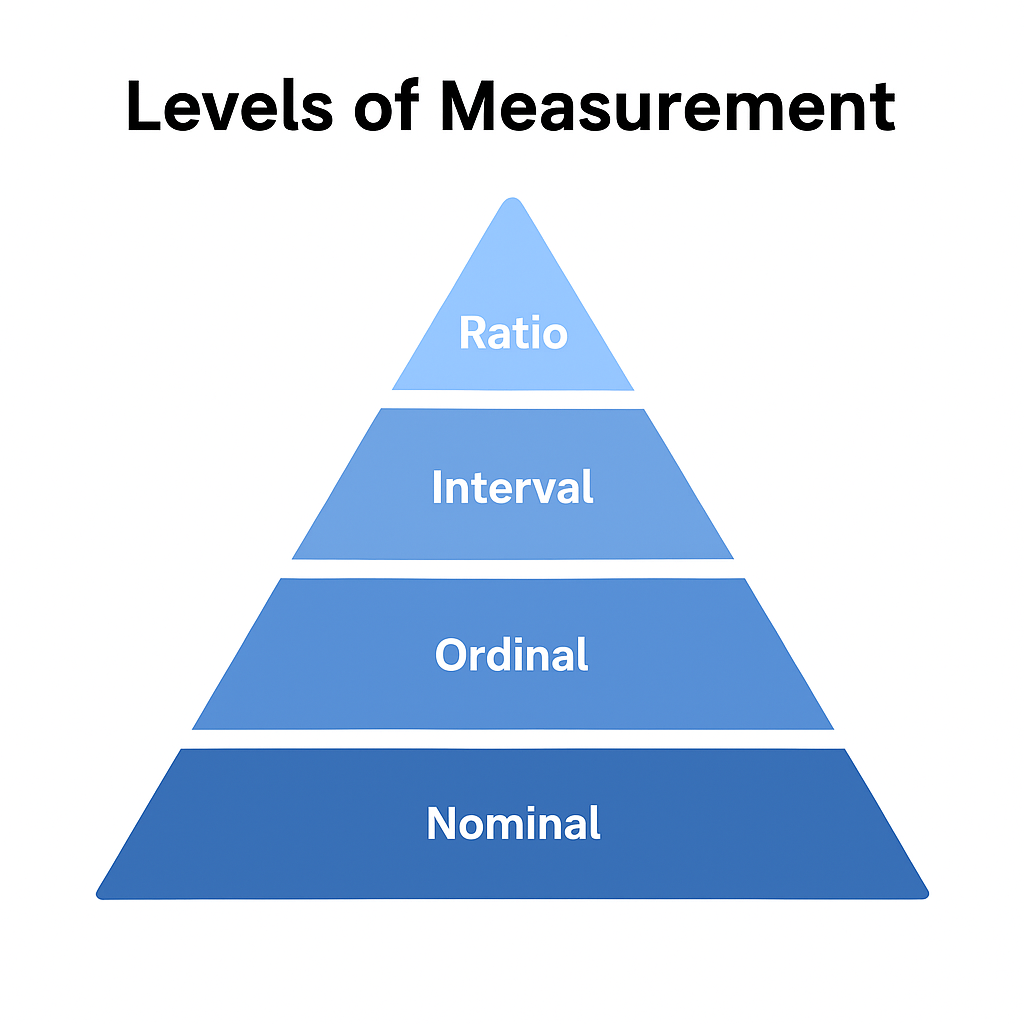
In statistics, data is classified into 4 levels of measurement—nominal, ordinal, interval, and ratio. Nominal comes at the lowest level of measurement and it consists of categories with no order or numeric value.
Nominal data, also called the nominal level of measurement, is the simplest and widely utilized type of data in statistics. Nominal data is qualitative data that communicates purely descriptive information, and involves labeling, naming or classifying variables. Nominal data does not signify numerical or quantifiable information. In other words, nominal data includes categories, not quantities.
The word nominal derives from the Latin nomen, meaning name—and this explains why nominal data are often referred to as “in name only.” You can name or classify variables into different categories; however, you cannot rank, measure or compute with them i.e. perform any arithmetic operations on them. For example, you can assign numbers to represent categories (1 = Male, 2 = Female and 3 = Non-binary). This would not indicate that “3 is greater than 1”. The numbers are merely convenient codes or names for labels, not actual values.
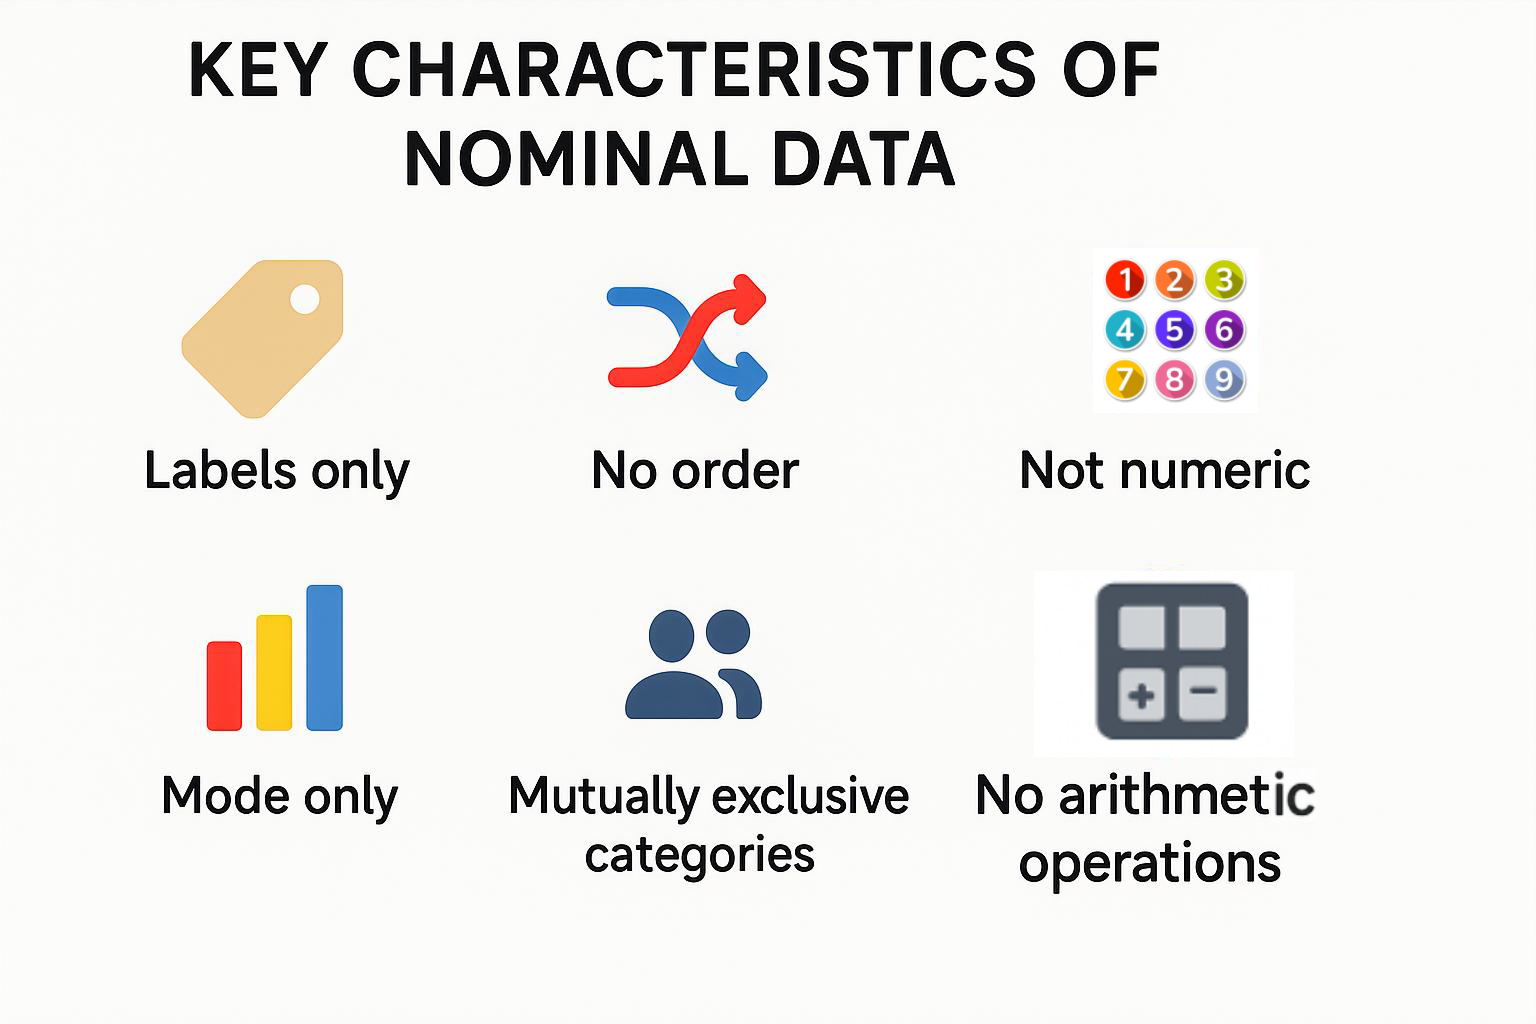
It is qualitative, not quantitative.
Categories are mutually exclusive – an observation can be in only one category at a time.
There is no logical order among the categories.
It is the simplest level of data measurement, and the first phase of a hierarchy that progresses from nominal → ordinal → interval → ratio scales.
Consider an example: A survey question such as: “What is your preferred mode of transport?”
Here are the options:
Car
Bus
Train
Bicycle
Here, each option represents a nominal category. The responses are equally valid as they cannot be ranked, and are useful only for classification purposes. Saying “Car” is not better, greater, or less than “Bus”—they’re simply different groups.
Each of these examples highlights the non-numeric, unordered nature of nominal data.
While nominal data may seem to be the simplest sort of data, it is an essential element of research, analytics, and decision making. Businesses may use it to differentiate segments of audiences by gender, by country, or preferences. Healthcare professionals may differentiate patients by blood type or by status of condition. Social scientists may differentiate populations based on ethnicity or political views. Nominal classification is the foundation of any decision making process, as it is impossible to organize or interpret a higher level of complexity without first classifying based on the most simple nominal classifications.
Nominal data have features that distinguish them from other types of data—ordinal, interval, and ratio data. When a researcher or analyst understands these characteristics of nominal data, it assists them to conduct the appropriate analysis and avoid making errors in interpretations.
Every data point or observation falls into a single category and those categories are not overlapping. For example, imagine a survey asking about blood type. A respondent is either A, B, AB, or O. They cannot be in two categories at the same time. Example: A retailer of clothing is interested in knowing about customer preferences, and classifies them as “Formal wear, Casual wear, Sportswear, Traditional wear”. Each purchase fits under a single category.
Nominal categories have no order. One label is neither higher, better nor lower than another. For example, consider classifying people by eye colour – blue, green, brown, hazel: There is no inherent order to that classification. If you attempted to rank them, it woud be statistically meaningless. Example: In politics, the categories “Party A, Party B, Party C” are identifiers, not ranks. Party C is not greater or lesser than Party A—it’s just another label.
Nominal data cannot be summarized to a number. However, nominal categories can have numbers assigned to them, for e.g. 1 = Male, 2 = Female, 3 = Non-binary; for the ease of storing or analyzing the data. The numbers are essentially only codes. There is no math value in the numbers and they cannot be used for arithmetic. Example: If a dataset says "1 = Apple, 2 = Banana, 3 = Orange", it does NOT mean that Orange (3) is MORE than Banana (2) -- they are just simply codes or identifiers for a category of fruit.
In nominal data, the mode—the most frequently occurring category—is the only legitimate measure of central tendency. Neither the mean nor the median applies, since the values are labels, not quantities. Example: If 100 people are surveyed about their favorite pet and the outcomes are:
40 choose “Dog”
30 choose “Cat”
20 choose “Bird”
10 choose “Fish”
The mode is “Dog”, and that makes it the most popular pet choice in the sample.
Nominal data can take the form of—words, symbols, or numbers, according to the situation/context. Thus, it is useful for surveys, coding, and large databases. For example, gender can be coded as "M" and "F", or two numerical values 0 and 1 for dimensionality reduction. Despite its different manifestations or formats, the data is still a qualitative measure.
Within the four levels of data measurement (nominal, ordinal, interval, ratio), nominal data sits at the base. Although nominal data is the most basic data level, it functions as the building blocks for higher quality data levels. Most research begins with nominal data before advancing to more complex scales.
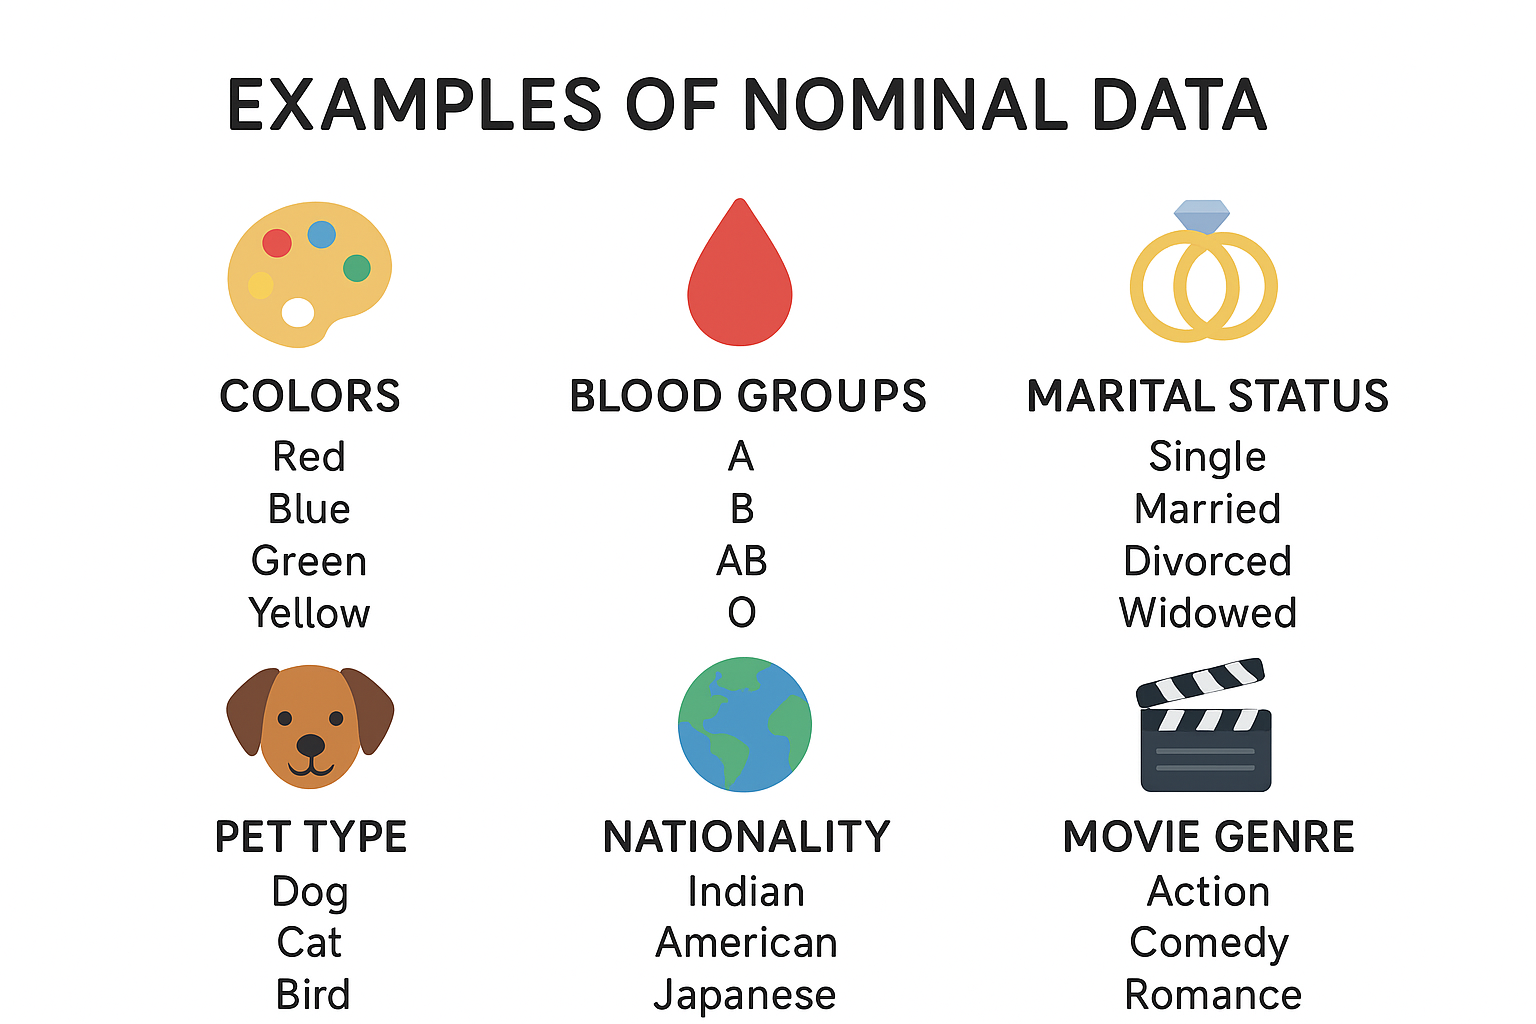
Nominal data is everywhere—influencing our everyday decisions, research, and business intelligence. Because nominal data is designed for classification without any order or value, you can see nominal variables used in surveys, healthcare, marketing, and education. Here are some examples in different scenarios:
Demographic variables are among the most typical applications of nominal data, assisting researchers and organizations in classifying groups for analysis. Some examples are:
Gender/Identity - Male, Female, Non-binary, Prefer not to say
Nationality - Indian, American, Japanese, Nigerian
Ethnicity - Hispanic, Asian, Caucasian, African American, Indigenous
Marital Status - Single, Married, Divorced, Widowed
This form of demographic categorization enables governments to conduct censuses, allows businesses to segment target audiences, and facilitates social scientists’ examination of cultural and societal trends.
Nominal data can also be used to show preferences or just put things into groups. This is useful in surveys or consumer research because it helps to see patterns in choices people make. A few examples are:
Movie Genres – Action, Comedy, Romance, Documentary, Horror
Food Preferences – Vegetarian, Vegan, Non-vegetarian, Pescatarian
Blood Groups – A, B, AB, O
Sports Teams – Manchester United, Real Madrid, LA Lakers, Chicago Bulls
Pet Types – Dog, Cat, Fish, Bird, Reptile
Companies use these groupings in different ways. For example, streaming sites sort movies into categories so people can find what they like more easily, and restaurants often break menus down by type of cuisine.
Certain categories might appear numeric but are really only identification labels, not values. Some examples are:
Zip Codes/Postal Codes - 10001, 560001, 90210
Student IDs - S001, S002, S003
Phone Area Codes - +1, +44, +91
Jersey Numbers - A player with "#10" jersey is not "larger" than one with "#7"—the number is merely an identifier.
These labels are crucial in administrative systems and databases, enabling organisations such as schools, hospitals, or internet businesses to sort and retrieve records effectively.
Some nominal variables consist of only two values, referred to as binary or dichotomous data. Typical examples of this include:
Yes/No - “Do you possess a car?” (Yes, No)
Success/Failure - Exam result (Pass, Fail)
Presence/Absence - Medical condition (Present, Absent)
On/Off - Device status
This kind of information is especially prevalent in science and technology—clinical trials, for instance, generally categorize outcomes as success or failure, and computers track their running status as on or off.
Nominal categories are essential in the classification of medicine. Some examples are:
Blood Type - A+, A–, B+, B–, AB+, AB–, O+, O–
Diagnosis Categories - Diabetes, Hypertension, Asthma, Heart Disease
Allergy Types - Food allergy, Pollen allergy, Drug allergy
Hospital Wards - General, ICU, Pediatrics, Maternity
Healthcare practitioners classify patients, monitor health trends, and customize treatment protocols using these categories.
In business, nominal variables assist in grouping and comparing customer and product information. Some examples are:
Customer Segments - New customer, Returning customer, VIP customer
Product Categories - Electronics, Furniture, Apparel, Beauty products
Geographic Regions - North America, Europe, Asia-Pacific, Middle East
Brands - Nike, Adidas, Puma, Reebok
These categories assist companies in comparing regional performance, monitoring product categories, and gaining insight into customers' behavior.
Often in academics and social research, researchers use nominal data to categorize types of education and social research. Examples of nominal data in education are:
Study Subjects - Math, Physics, History and Literature
Type of School - Public, Private, Charter, Online
Survey Responses - Religion, Political affiliation, Language spoken at home
If categorically classified the researchers will be able to detect trends in education, understand social diversity, and construct more inclusive policies.
The distinction between nominal and ordinal data is clear, but can easily be confused, especially since both nominal and ordinal data are categorical data types. The difference is the order and ranking.
Nominal data is strictly labeling an instance into a category that has no order or rank (for example, colors: red, blue, and green).
Ordinal data is also categorical data, except the categories have a logical order or rank, but the distance between ordered ranks is not measurable.
Let's consider the Example: Customer satisfaction ratings—Poor, Fair, Good, Excellent—are ordinal. This is because the categories have an order, but you cannot quantify the exact difference between—“Fair” and “Good.”
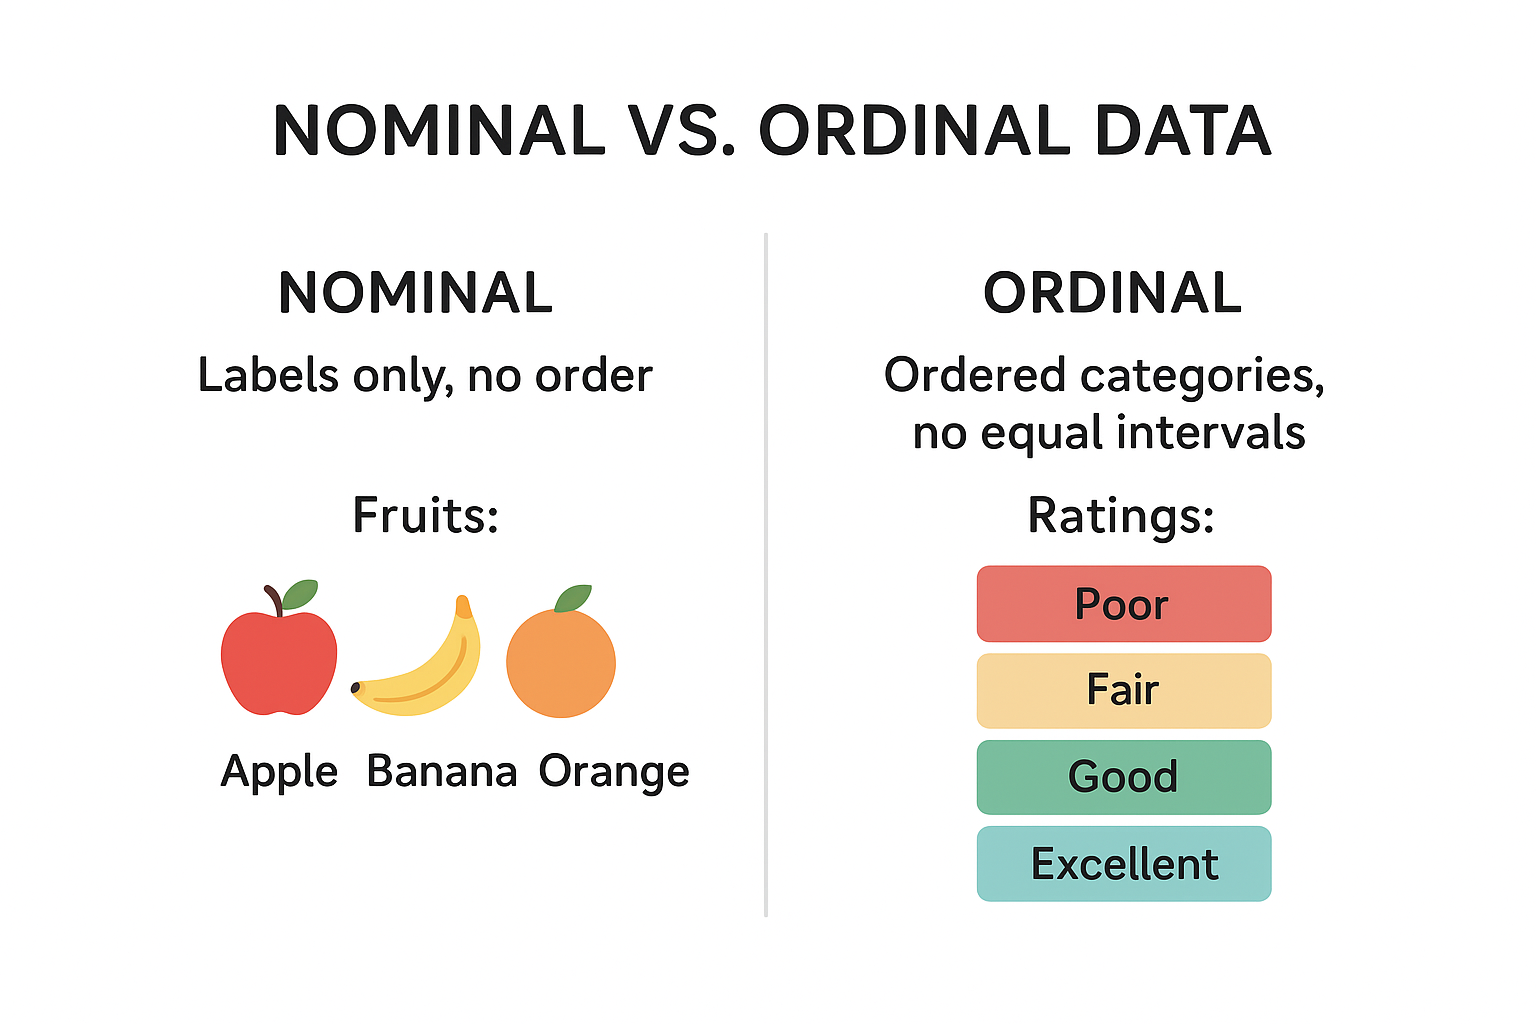
Thus, while both data types classify information, only ordinal data carries a meaningful order.
Here are the vital distinctive pointers between nominal and ordinal data:
|
Aspect |
Nominal Data |
Ordinal Data |
|
Order/Ranks |
No intrinsic order |
Has a logical ranking/order |
|
Numerical Meaning |
None |
Some sense of relative magnitude |
|
Examples |
Color, nationality, pet type |
Education level, customer satisfaction rating |
|
Operations Allowed |
Only mode |
Mode; sometimes median, though with caveats |
While both data types are categorical (qualitative), ordinal data gains an edge by possessing a rank, even if intervals between ranks are uneven—unlike nominal data, where no ordering exists.
Nominal data collection typically relies on:
Closed-ended questions: Refined categories, such as multiple choice or dropdowns (“Select one: Hair color”).
Open-ended responses: Later coded into categories, for example, “What nationality are you?” with later classification.
After collection, data may be encoded (e.g., assigning numeric codes), but this process remains purely symbolic—no mathematical operations are implied.
Since nominal data is categorical, the analysis focuses on frequency and proportion, not arithmetic operations like mean or standard deviation.
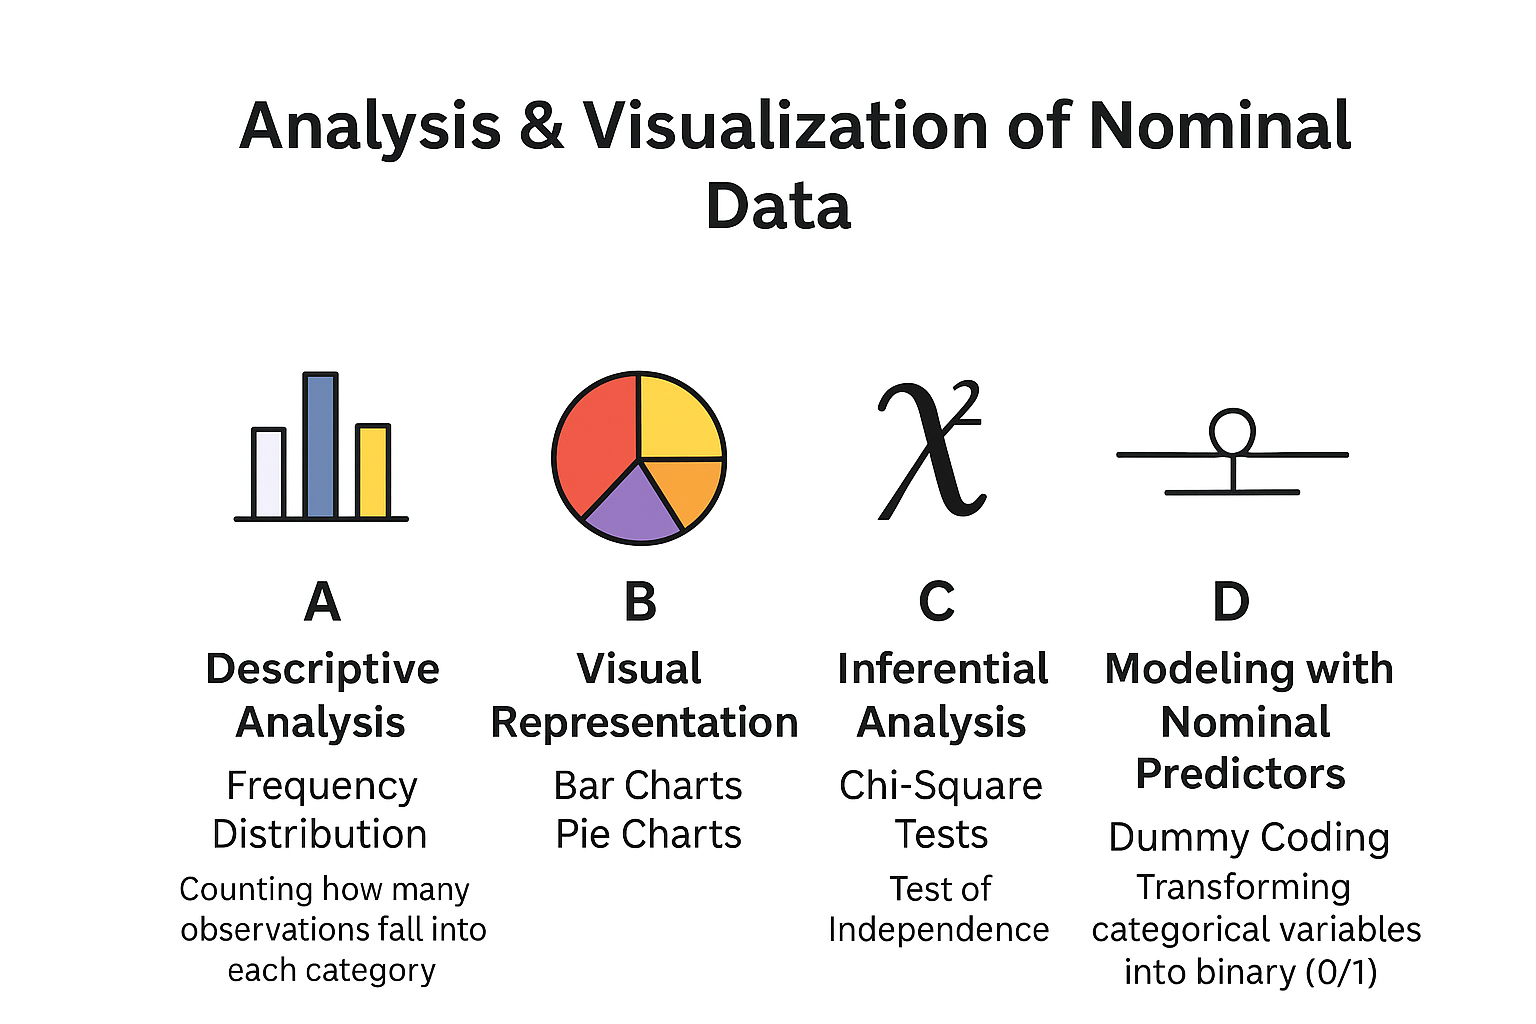
Here’s how nominal data can be comprehensively analyzed:
Frequency Distribution: Counting how many observations fall into each category, often represented in tables or charts.
Central Tendency (Mode): Identifying the most frequent category is the only meaningful measure.
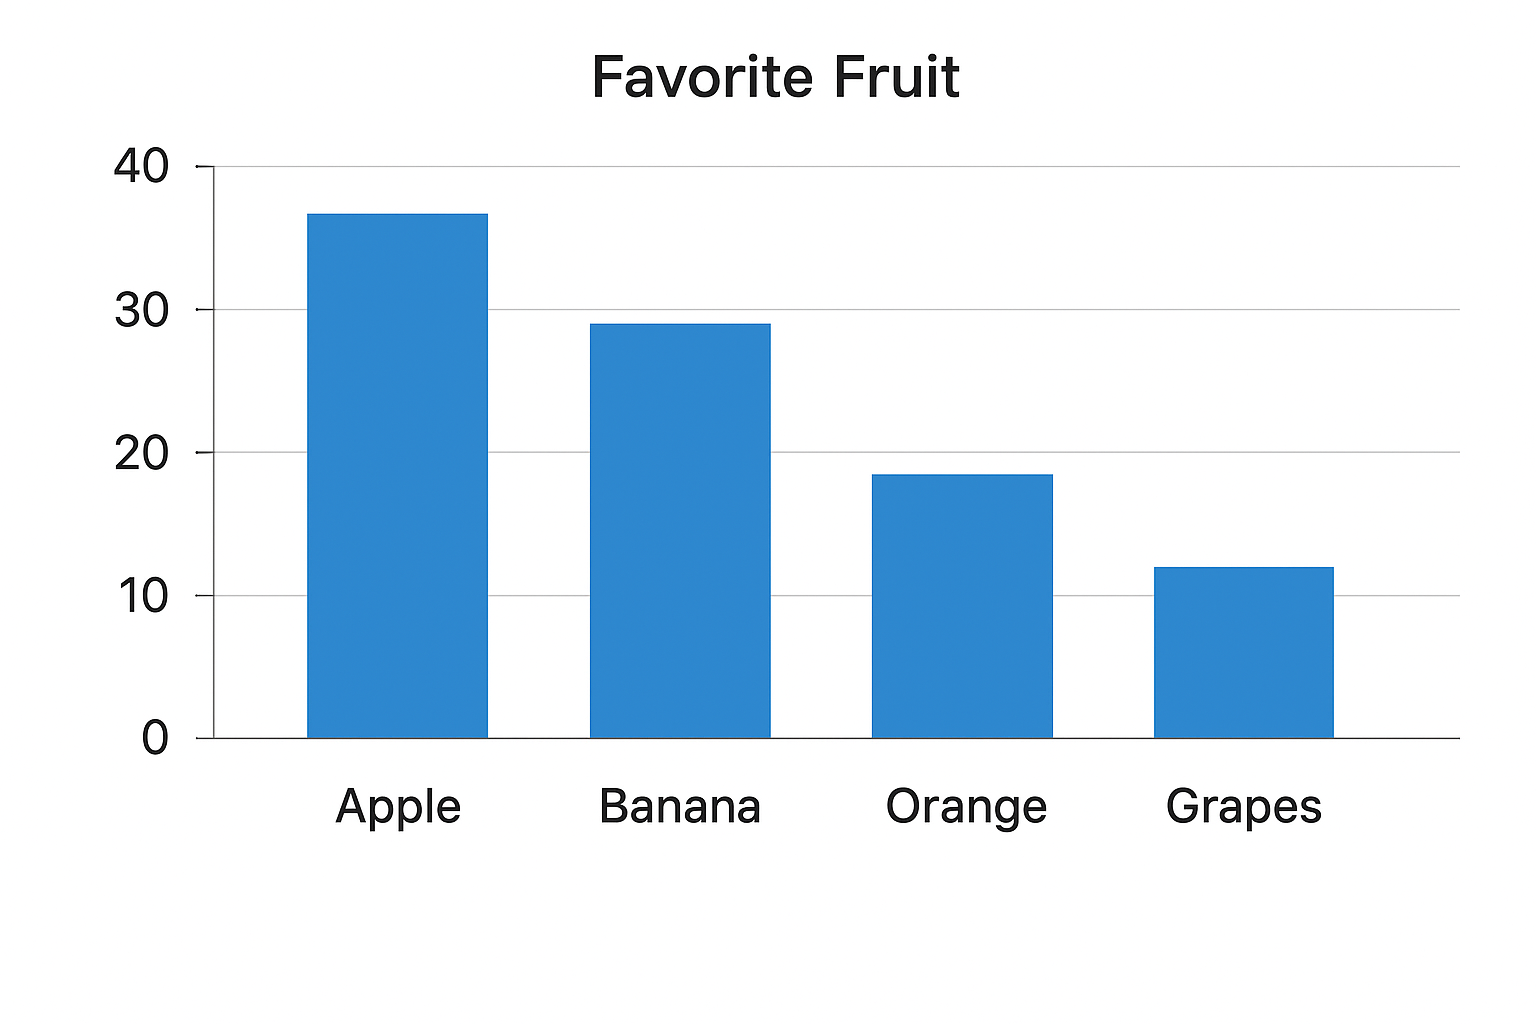
Bar Charts: Effective for comparing category counts.
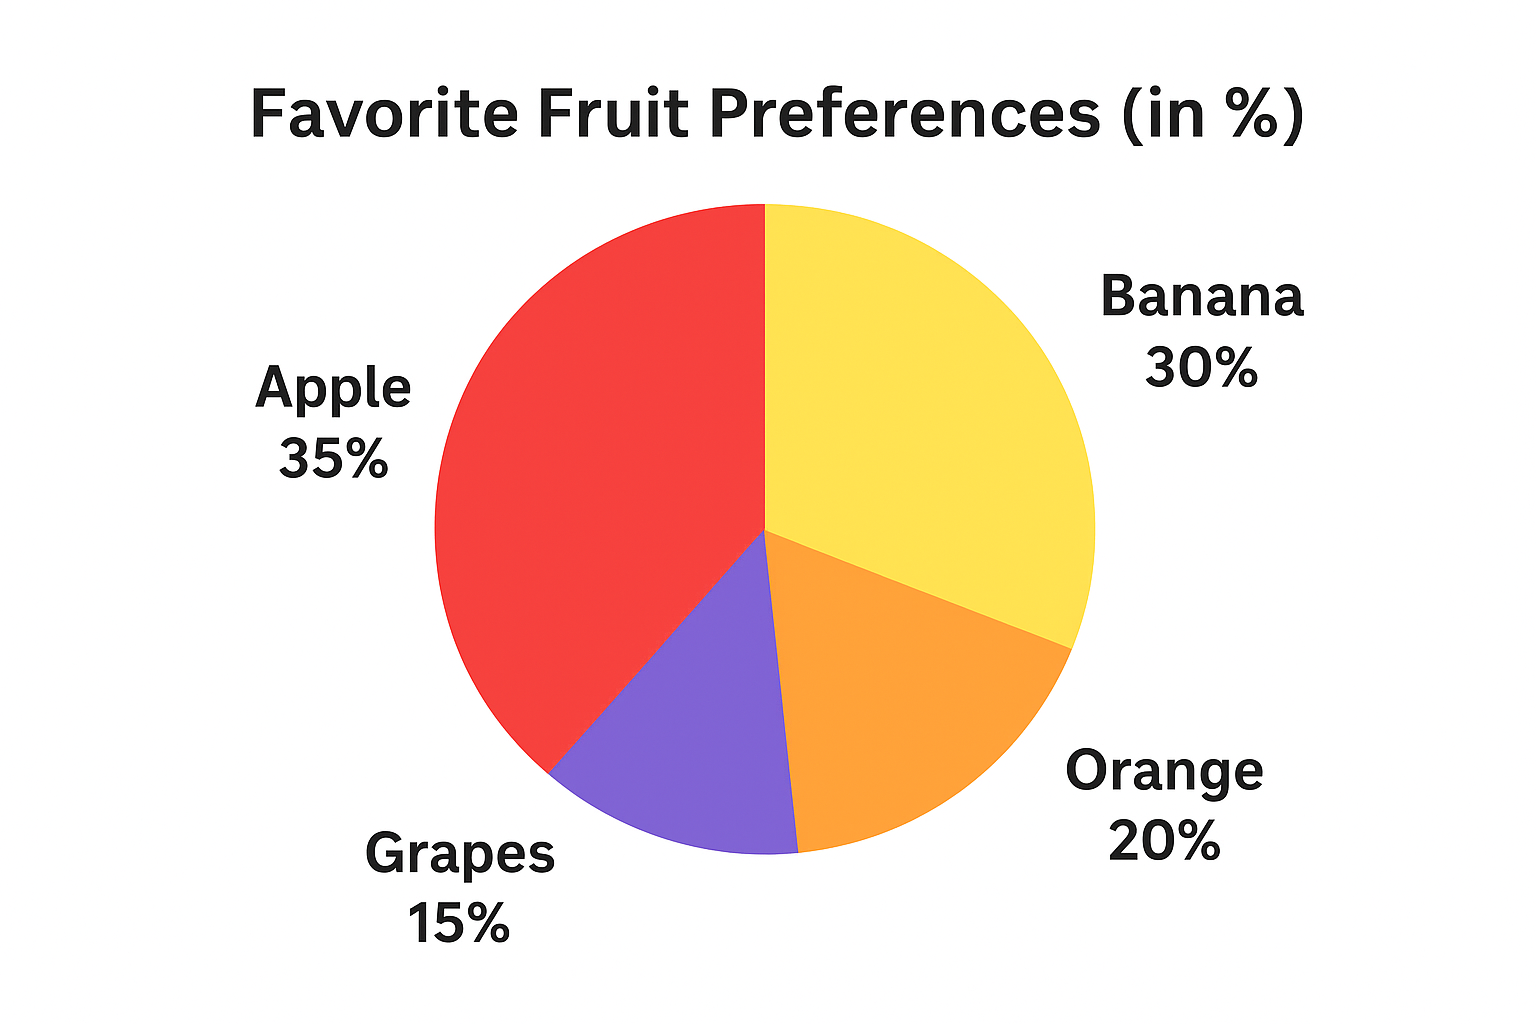
Pie Charts: Good at showing percentage share of each category.
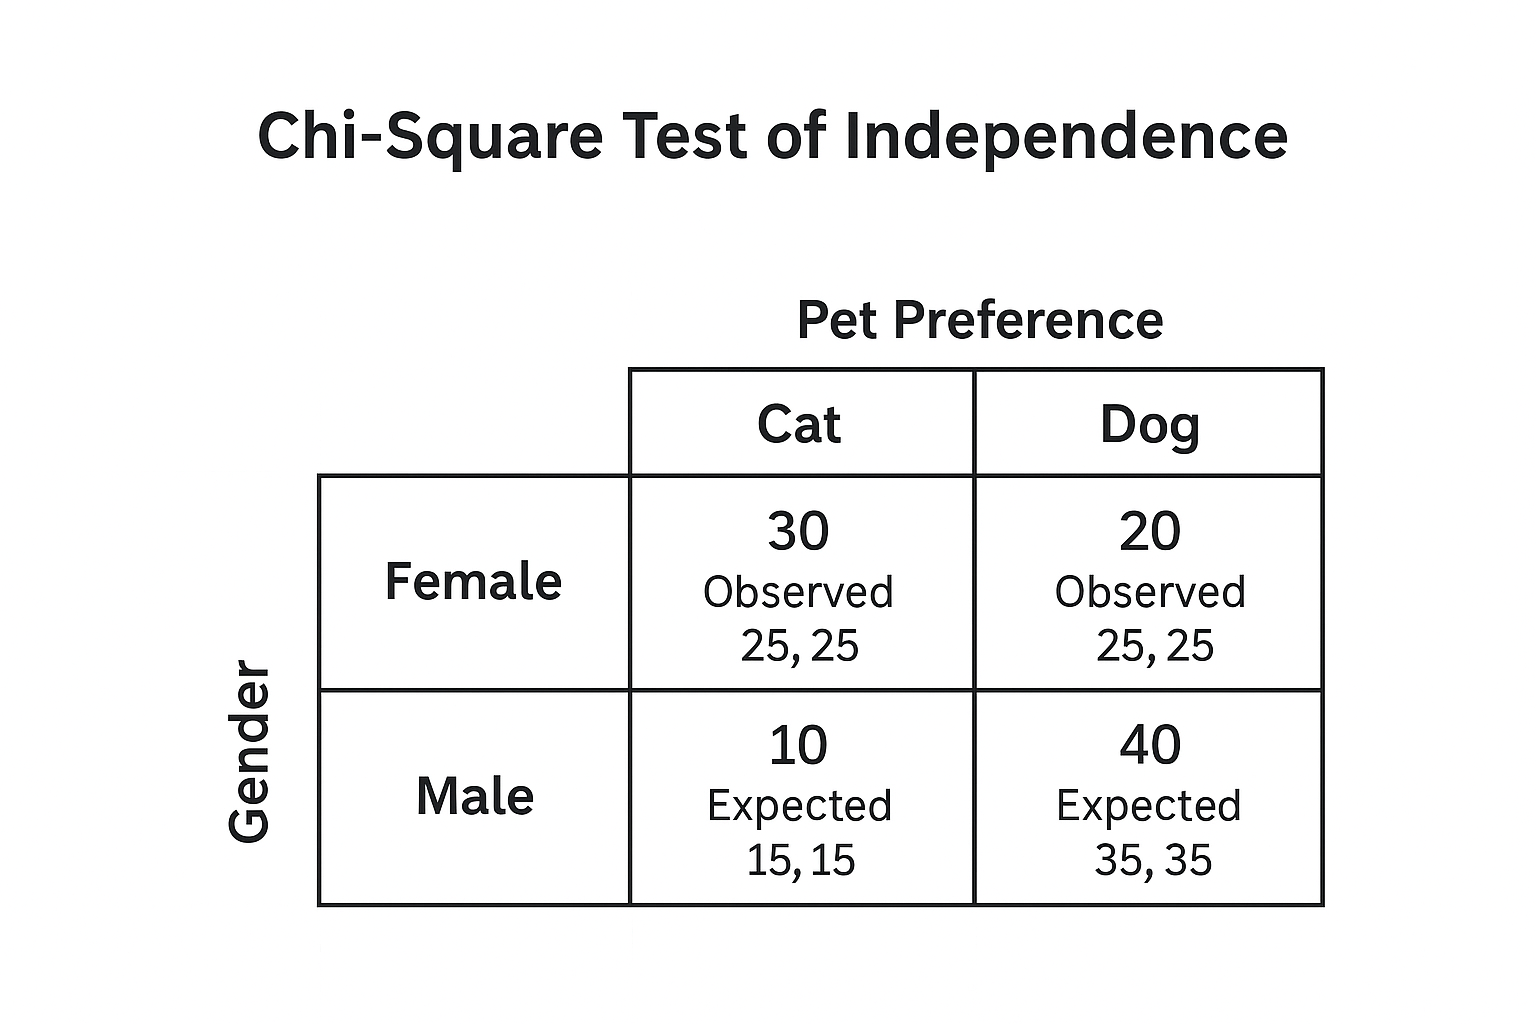
Chi-Square Tests:
Test of Independence: Checks if two nominal variables are related.
Additional Tests: Fisher’s exact test, Cochran’s Q test, and McNemar’s test are useful for nominal data in specific scenarios.
In regression contexts, nominal variables are dummy-coded—transformed into binary (0/1) variables—and used as predictors. For a variable with g categories, g–1 dummy variables are created to avoid redundancy and ensure proper interpretation.
|
Analysis Type |
Explanation / Example |
|
Frequency counts |
Count how many observations fall into each category. e.g., 40 males, 60 females. |
|
Percentages / Proportions |
Convert counts into percentages. e.g., 40% male, 60% female. |
|
Mode |
The most frequent category. |
|
Cross-tabulation (Contingency tables) |
Examining relationships between two nominal variables. e.g., Gender vs. Preference. |
|
Chi-square test |
Testing association between two categorical variables. e.g., Is preference independent of gender? |
|
Bar charts / Pie charts |
Visual representation of category distribution. |
Note: You cannot calculate the mean, median, or standard deviation with nominal data. This is because the numbers (if coded as 1, 2, 3) are simply labels, not values.
Because nominal data is foundational for classification and segmentation, it is relevant for nearly every facet of an enterprise. From creating surveys to building dashboards to managing health records, nominal data helps us make sense of complicated data and take action.
Surveys rely heavily on nominal data to categorize respondents by demographics or preferences. For instance:
Classifying respondents by age group, gender, or location
Collecting brand preference (Nike vs. Adidas, Coke vs. Pepsi)
Asking categorical questions like “Which social media platform do you use most?”
This data helps marketers segment audiences, identify patterns in consumer behavior, and tailor campaigns accordingly.
Nominal data is a cornerstone of healthcare studies and sociological research. It allows professionals to group people into meaningful categories:
Blood type classifications for medical planning
Disease presence/absence in epidemiology studies
Ethnic groups or gender categories in social research
Such classifications enable better public health policy, targeted awareness campaigns, and insights into population diversity.
Nominal data powers the tagging, segmentation, and filtering that drive dashboards and business intelligence tools. Examples include:
Grouping data by regions, departments, or product categories
Creating customer segments like new vs. repeat buyers
Tagging transactions by sales channel (online, retail, wholesale)
When visualized, nominal categories make dashboards more interactive—for example, a sales dashboard may allow filtering “by country” or “by product line” to focus insights.
In data science, nominal variables are often encoded for algorithms. Although the categories lack numerical value, they are transformed into machine-readable forms:
One-hot encoding: Assigning binary variables (e.g., Car = 1, others = 0)
Label encoding: Assigning numbers to categories for classification models
Feature engineering: Using nominal tags like “User Device Type” (Mobile/Desktop) in predictive models
This process allows AI and machine learning systems to make predictions, such as recommending products based on user demographics or preferences.
Educational institutions use nominal data to classify and report on student populations:
School type (public, private, online)
Subjects studied (math, science, history, arts)
Extracurricular activities (sports, debate, music)
Such categorizations help in policy-making, diversity studies, and resource allocation.
Governments use nominal classifications in record-keeping and policy analysis:
Census surveys group populations by gender, religion, or nationality
Election data is categorized by political party affiliation
Public records like license types, vehicle categories, or land use zoning
These categories guide decision-making, funding allocations, and governance structures.
At first glance, nominal data appears simple—but it's foundational. Whether you're tabulating survey categories, coding variables for modeling, or constructing compelling content, understanding nominal measurement is critical. Key takeaways of the article are:
Nominal data = categorical, labels-only, unordered.
Analysis revolves around frequency counts and mode; cannot perform arithmetic.
Advanced applications include chi-square testing and dummy coding for regression.